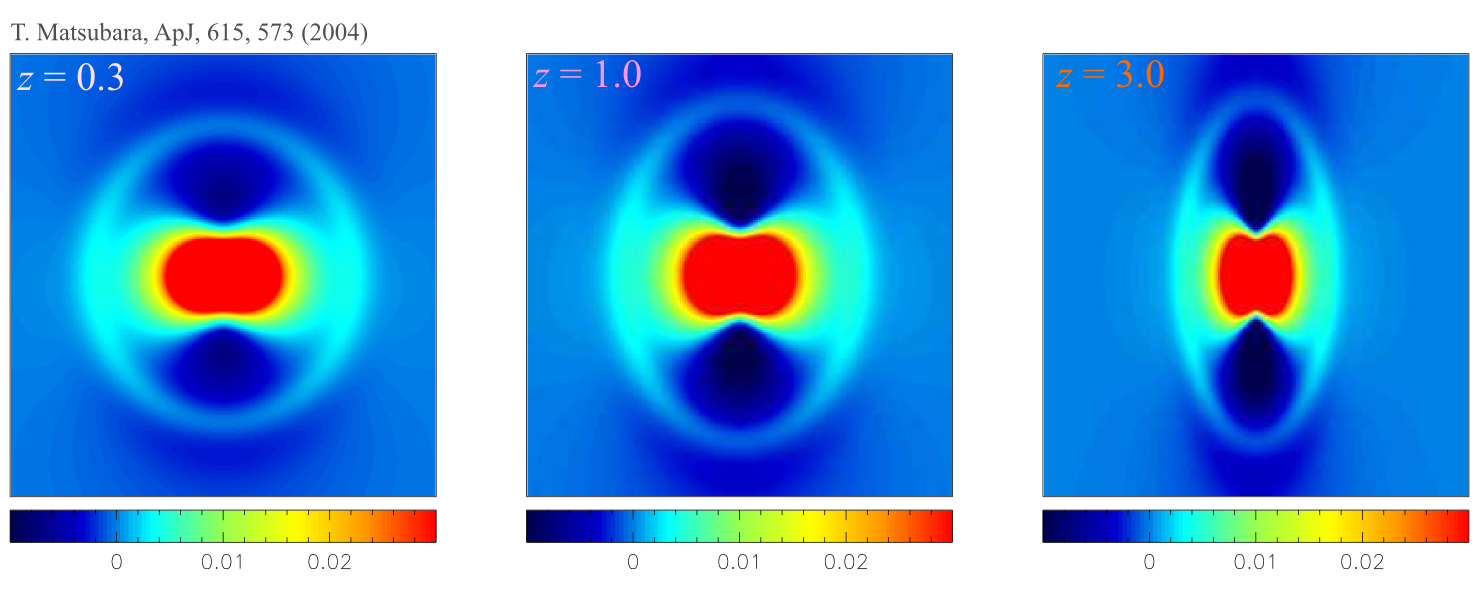
The 2-point correlation function in redshift space predicted by linear theory. Baryon Acoustic Oscillations (BAO) are seen as outer rings, which correspond to the acoustic scale of ~ 110 Mpc/h. The scale of these rings is the "standard ruler," which is used to measure the dark energy component of the universe. Lines of sight are in the upper direction.
Ref.) T. Matsubara, ApJ, 615, 573 (2004)

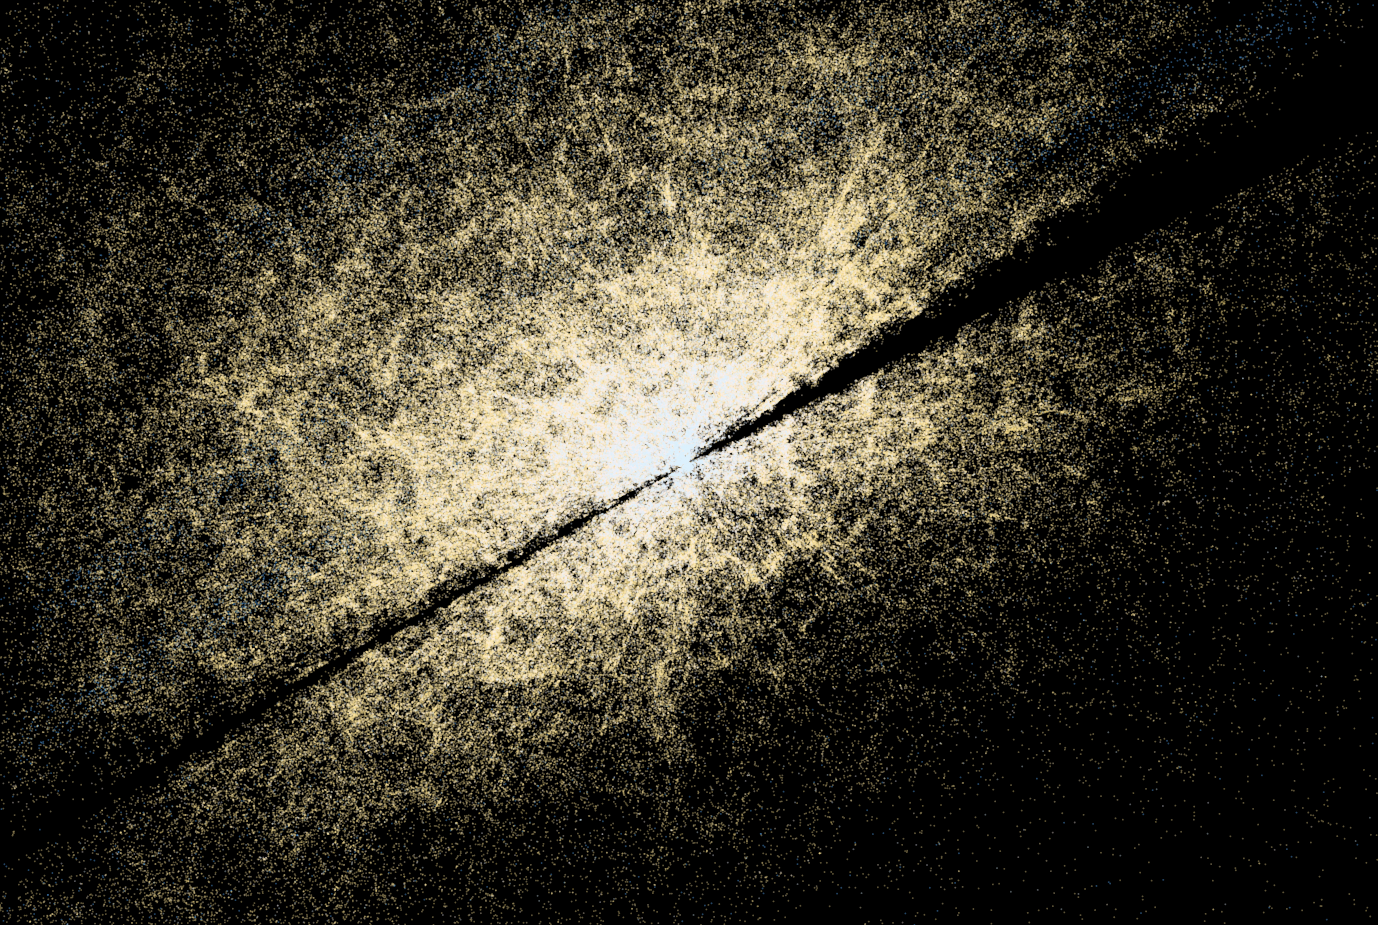
Three-dimensional Large-scale distributions of galaxies obtained by the Sloan Digital Sky Survey (SDSS, http://www.sdss.org) project, which I took part in. Position data of SDSS galaxies is visualized by utilizing the Mitaka software, which is a product of the 4D2U project (http://4d2u.nao.ac.jp) in National Astronomical Observatory of Japan (NAOJ).
Credit: Mitaka: 2005 Tsunehiko Kato, ARC and SDSS, 4D2U Project, NAOJ, Takahiko Matsubara

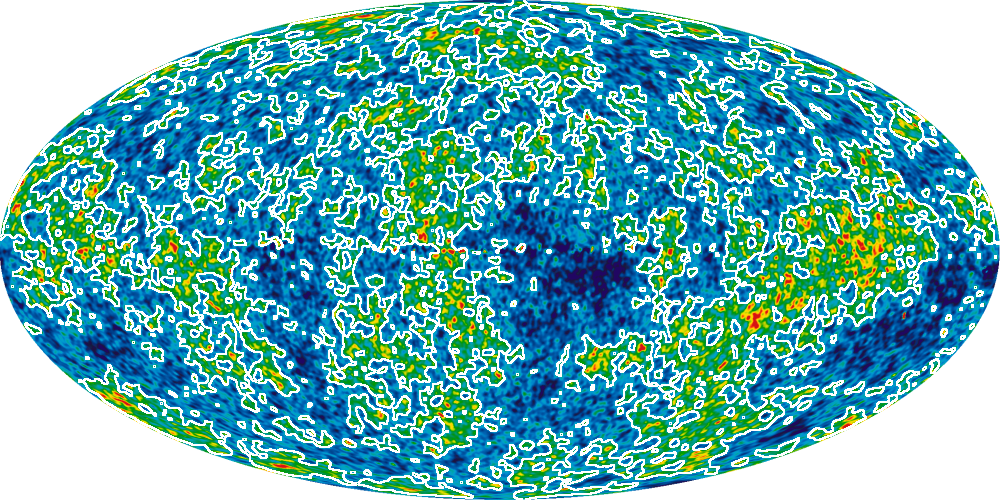
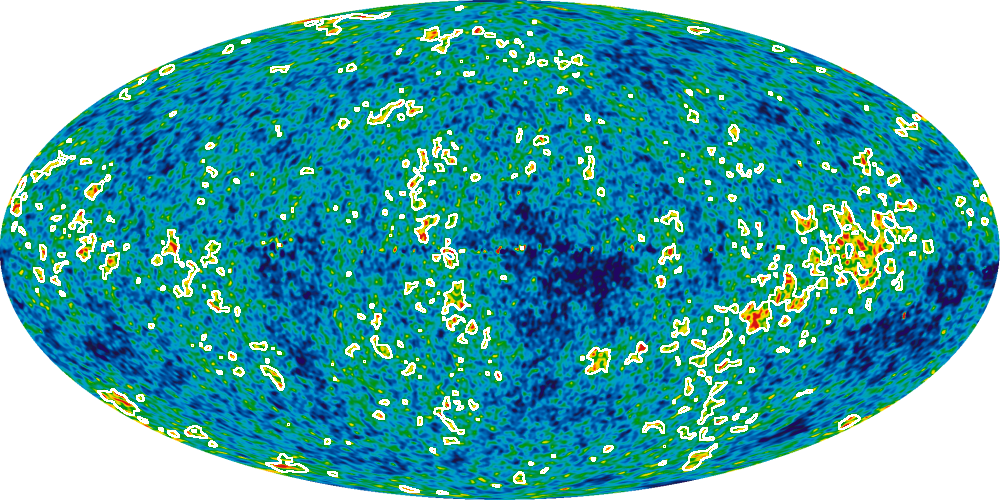
The first three are isotemperature contours of CMB. The last one is a movie which shows the high-temperature regions with varying threshold temperature. A WMAP7 image ( http://lambda.gsfc.nasa.gov/product/map/current/) is used. Cosmological information can be extracted from statistical properties of geometrical structures in the isotemperature contours. Specifically, Minkowski functionals are useful to detect the primordial non-Gaussianity and constrain models of the early universe, such as inflationary theories.
Original WMAP image, credit: WMAP Science Team, NASA
Related papers:
T. Matsubara, PRD in press (2010);
C. Hikage et al., MNRAS, 398, 2188 (2009);
C. Hikage et al., MNRAS, 389, 1439 (2008);
C. Hikage, E. Komatsu and T. Matsubara, ApJ, 653, 11 (2006);
T. Matsubara, ApJ, 584, 1 (2003)
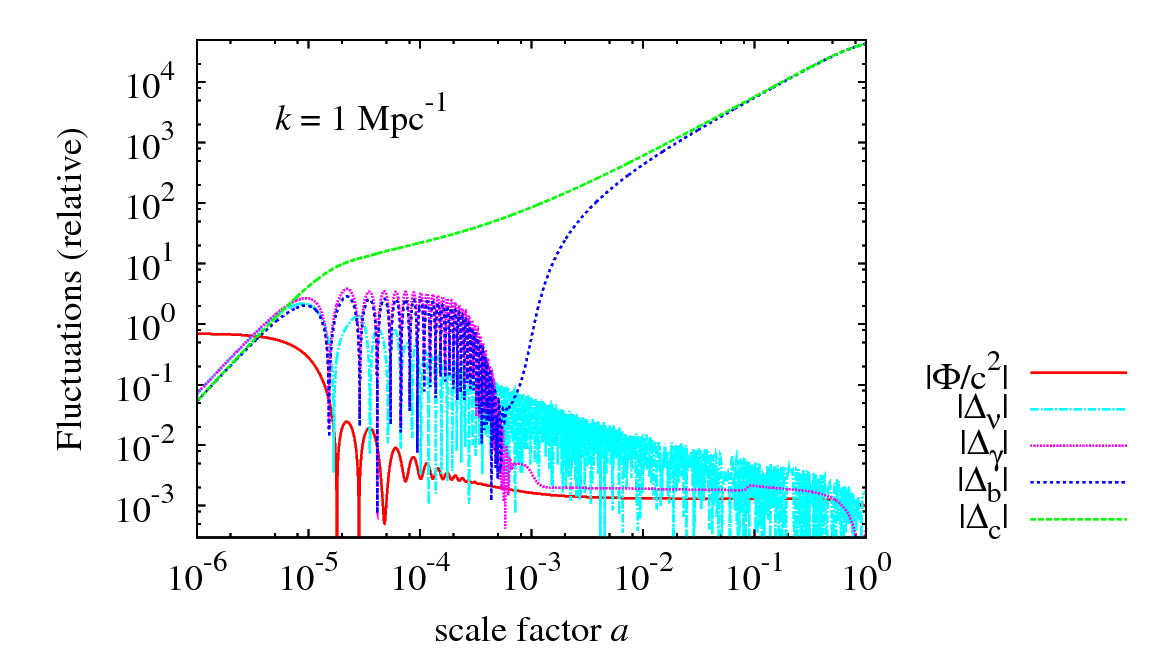
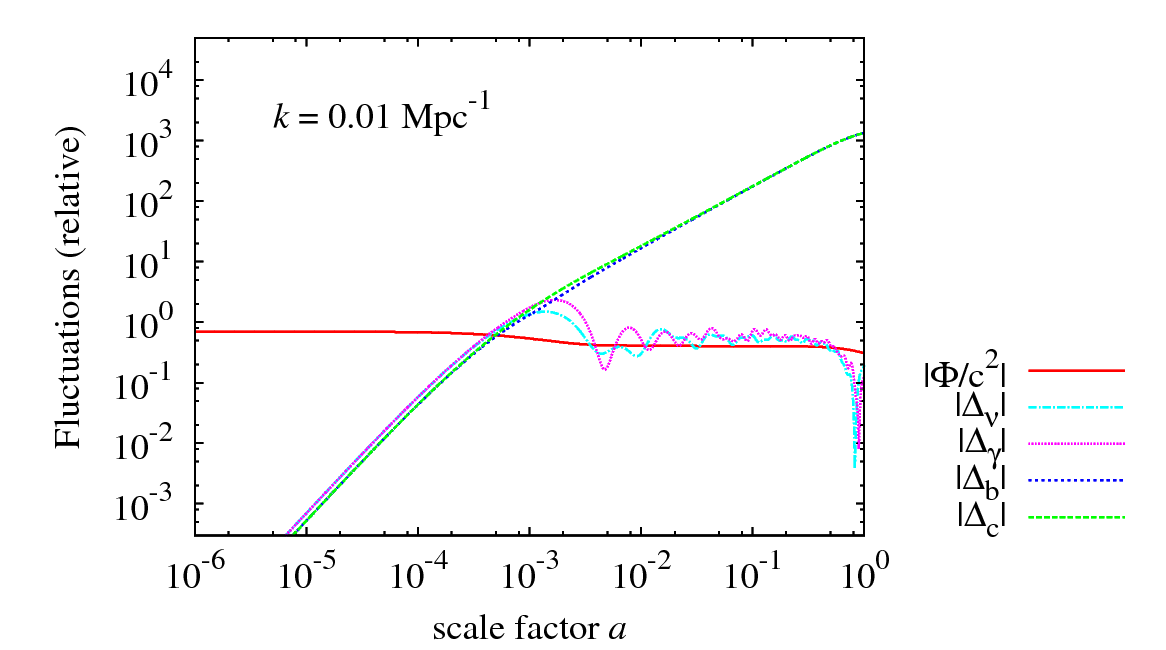
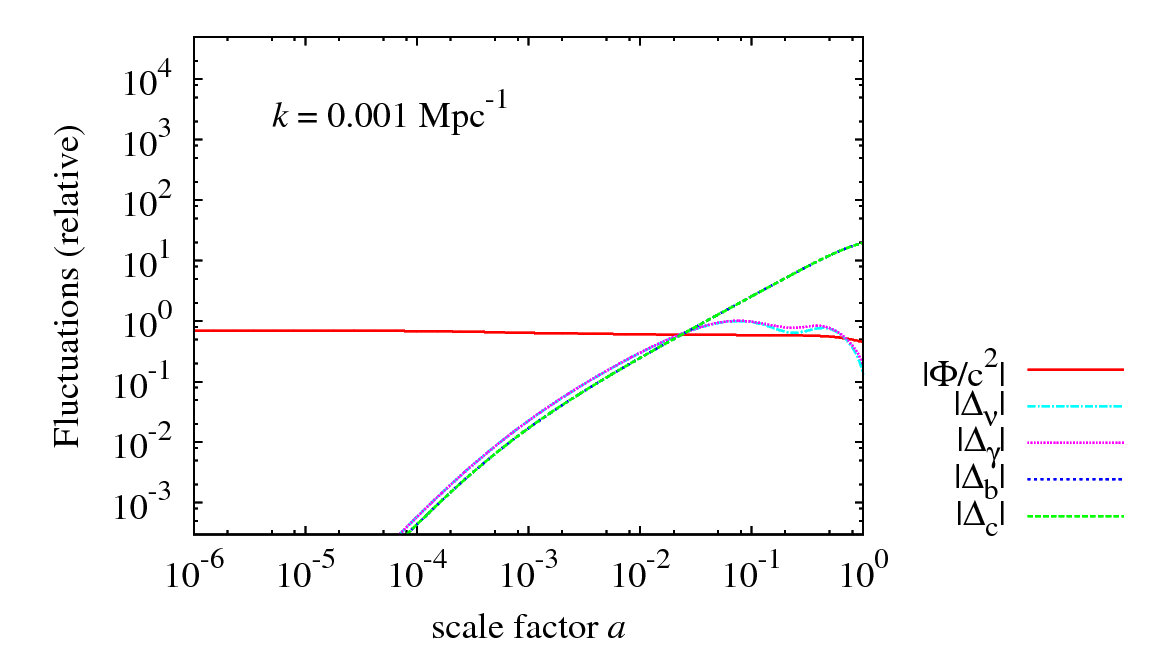
Time evolutions of density perturbations for various components in the universe. Perturbations of a wavelength which enters the Hubble radius (top) during the radiation dominated epoch, (middle) near the matter-radiation equality time, (bottom) during the matter dominated epoch, are shown. Perturbations of potential, neutrinos, photons, baryons, and the cold dark matter (synchronous gauge) are plotted. Relative amplitudes of perturbations are given as functions of the scale factor. The calculations are based on the public CAMB code (http://camb.info) by A. Lewis, which is modfied to make this plot with help of K. Ichiki.
Made for 2010 Winter school at NAOJ.
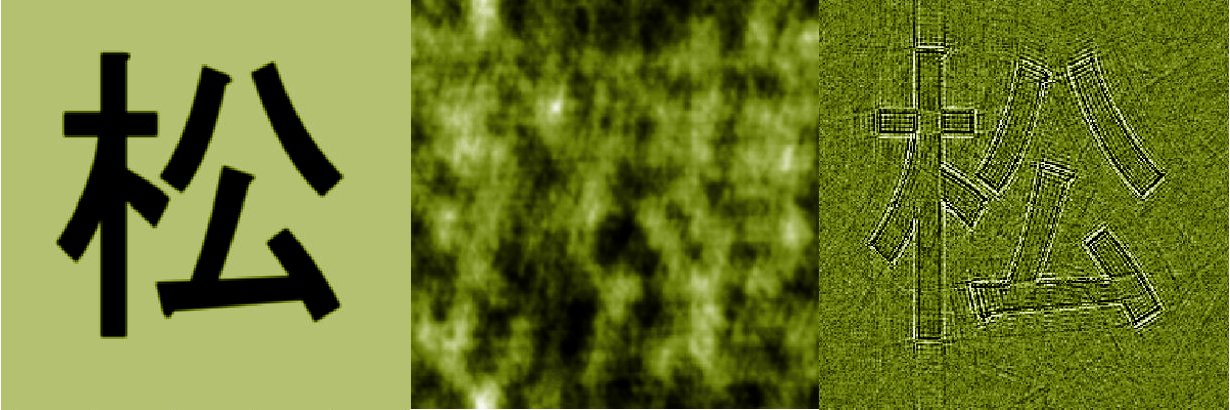
Role of the Fourier phases. Left: original image. Center: only Fourer amplitudes are kept, randomizing Fourer phases. Right: Fourer amplitudes are made constant, keeping Fourier phses. Orignal idea of this presentation is due to A. Szalay and P. Coles.
Related papers:
T. Matsubara, ApJS, 170, 1 (2007);
T. Matsubara, ApJL, 591, L79-L82 (2003)
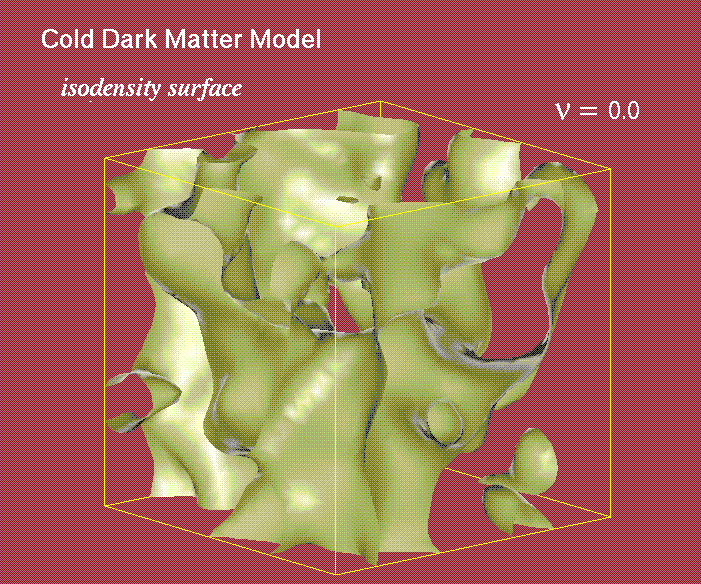
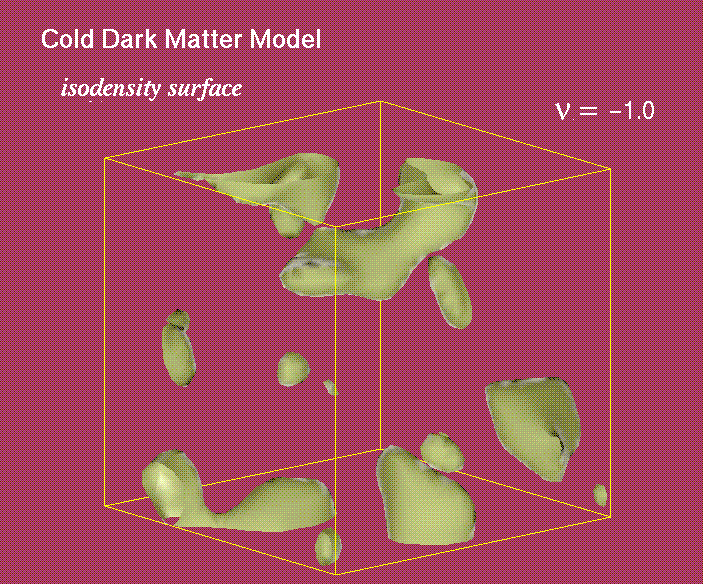
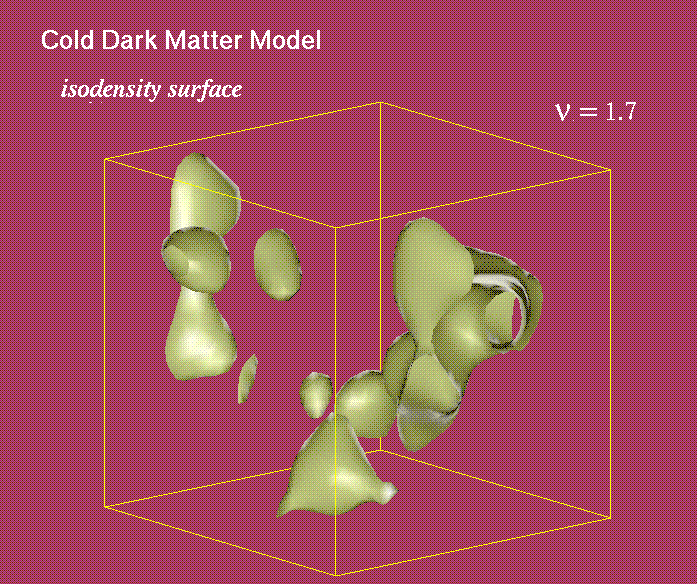
Three-dimensional shape of isodensity surfaces of the large-scale structure of the universe, calculated from a numerical simulation. Statistics of the isodensity surfaces, such as the genus statistic, or the Minkowski functionals, are useful to discreminate cosmological models.
Related paper:
Matsubara & Suto, ApJ, 460, 51 (1996)


